Wednesday, October 30, 2013

Corsi, shot quality, and the Toronto Maple Leafs, part III

My last two posts argued that there might be an inverse relationship between shot quality and shot quantity -- or, in other words, between Corsi and shooting percentage (SH%).  

Most hockey analysts disagreed with me.  Which is fair enough; so far, the only evidence I've really put forward is the negative correlation, the last two years, between Corsi percentage and  shooting percentage.  In each of the seasons 2011-12 and 2012-13, in even-strength tie-game situations, the team correlation was -0.24.  Before that, it was close to zero.  

I spent the last week searching for other evidence, and I think I finally found something.

-------

If shooting percentage in tie games is just luck -- or mostly just luck -- you should expect no correlation between shooting percentage this year, and shooting percentage next year.  And that's pretty much what you see in the data.  From 2007-08 to 2011-12, the team "that-season-to-next-season" correlation was only about 0.03 -- virtually zero.  (All "Corsi" numbers in this post are even-strength tie-game situations only.)

Doing the same thing to predict goal percentage from goal percentage (the percentage of goals in your games that are yours), I found a stronger relationship, a correlation of 0.27.

And, as the hockey analytics community has shown, this year's Corsi is even better for predicting next year's goal percentage.  That correlation came out to 0.40.  

So: Corsi is an excellent predictor, and shooting percentage appears to be just random.  So, you'd expect that if you try to predict next year's goals from this year's Corsi, knowing this year's shooting percentage shouldn't be much of a help.  Right?

Well, apparently, that's *not* right.  I ran that regression, and, surprisingly, shooting percentage was significant, both statistically and practically.  The SH% variable had a p-value of .09, and the actual effect was large.

It turned out that every point of shooting percentage was worth 0.83 points of goals next year.  So, if the league shooting percentage was 7.5%, but you had 8.5%, then, all things being equal, you should score 50.83% of goals next year.

Compare that to Corsi.  Every point of Corsi was worth 0.72 points of goals next year.  So, all things being equal, if this year you took 51% of shots, next year you should score 50.72% of goals.  

So, the two were roughly similar, on a percentage-point-by-percentage-point basis.

In the particular case of the 2012-13 Maple Leafs ... they had a shooting percentage of 10.82, as compared to the league average of 7.77 (actually, that 7.77 is equally weighting all teams, so the true mean is probably a bit lower that that, but never mind).  The difference of around 3.1 points corresponds to a goal percentage difference of 2.6.  That's quite a lot.

Of course, the Leafs' low Corsi percentage of 43.8 more than makes up for that.  So, I'm NOT saying this is a *good* strategy on the part of the Leafs (if, in fact, it *is* a strategy).  I'm just saying that I think that (a) the high shooting percentage is partly real, and (b) the low Corsi is partly the flip side of the high shooting percentage.

-------

But the relationship might even be stronger than that.  The above coefficients were for a regression that included five seasons worth of data, 2007-08 to 2011-12.  If I limit it to only the most recent three seasons, the results are even more striking.

For the past three seasons, the coefficient of SH% is substantially higher, at 1.21.  Meanwhile, the coefficient of Corsi stays pretty much the same, at 0.82.   Here, let me give you the regression equation:

Next Year G% = 0.82 (this year Corsi%) + 1.21 (this year SH%) - 0.12

In the Leafs' case, their 3.1-percentage-point advantage in SH% translates to a 3.75% increase in next year goal percentage.  Of course, their 6.2 percent disadvantage in Corsi works out to a 5.08% *decrease* in goal percentage.  Again, I'm not saying the Leafs are superstars or geniuses ... I'm just arguing that you might have to offset some of their exceptionally low Corsi with some of their exceptionally high SH%.

--------

Now, you might argue that I'm guilty of selective sampling, when I choose to look at only the last three seasons.  Which is true, except that I think you can justify the apparent cherry-picking, because there's other evidence that recent seasons are, in fact, different.  

And, actually, that difference is actually the most interesting thing I found in these numbers --  there seems to have been a sudden, recent change in the relationship between shooting and winning.  

Two years ago, Bruce McCurdy posted a study investigating the relationship between outshooting and winning games.  He found that from 1997-98 to 2007-08, the team with the most shots on goal in a game was significantly more likely to win.  In each of those seasons, the team with more shots had an aggregate winning percentages above .500.  (The league-seasons ranged from about .505 to .550.  The percentages were computed as the percentage of game points received, so as to create a league average of .500.  And the study counted all shots, not just tie-game shots.)

So, back then, if you got more shots, you tended to win the game.

But, in 2009-10, the situation reversed -- taking more shots meant you were more likely to have *lost* the game.  That year, the team with more shots had a winning percentage of only around .490.

In 2010-11, it got even more extreme.  The team with more shots played at only a .475 rate.  Put another way, teams that were outshot posted a .525 record!  That's almost the exact reverse of what it had been in prior years.  

Check out McCurdy's table from his article: twenty-five of the 30 teams had higher winning percentages in games where they were outshot.  

That's kind of shocking, in two ways.  First, who would have thought that getting outshot would tend to be connected to winning?  And, second, who would have thought that the relationship between shooting and winning would reverse itself within two seasons, with hardly anyone noticing?

McCurdy's study was written immediately after the 2010-11 season; I don't know if the reversal continued in future years.  However, I did calculate that last year, Toronto's record fit the pattern.  When the Leafs outshot their opponents, they were 5-7-0.  When they were themselves outshot, they were 21-10-5.  

-------

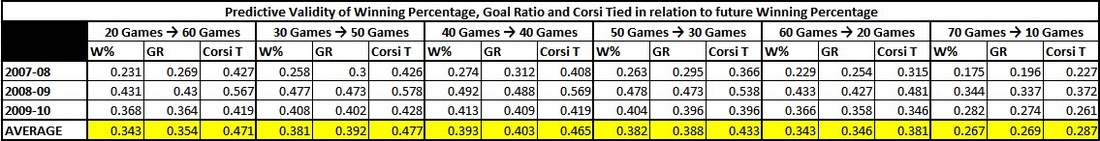
Here's another, similar, bit of evidence.  In a recent post (hat tip: Tango), garret9 points to some correlation numbers from JLikens.  Those look at early season numbers to try to predict future team wins in the same season.

In 2007-08, tie-score Corsi predicts the near future much better than goals.  For instance, if you use the first 40 games of Corsi to predict the next 40 games of winning percentage, the correlation is .408.  But if you use the first 40 games of goals, the correlation is only .312.

In 2008-09, Corsi is still better, but less so.  The corresponding r values are .569 for Corsi, and .488 for goals. 

But, in 2009-10, the difference disappears.  Now, Corsi and goals are almost the same, at .419 and .409, respectively.  As you move later in the season, the order reverses.  If you try to predict 30 games from 50, Corsi and goals actually "tie" at .396.  Predicting  the last 20 games from the first 60, (or 10 from 70), goals "wins" outright.

That probably wouldn't happen if shooting percentage wasn't measuring something real, would it?  

--------

What would cause these sudden changes?  Well, it could be that teams started to play an even more extreme style of hockey when leading.  Maybe it used to be that, when ahead in the game, teams would get outshot at a rate of, I dunno, 30-25, or something.  But, in recent years, maybe teams decided to switch to an even more "opportunistic" style, where they limit their offensive possessions and just capitalize on opponent mistakes, so then they started to get outshot at, I dunno, 33-22, or something.  

I just made those numbers up, for illustration, but maybe that's what could be happening.

Hey, wait, I can check that.  Seriously, as I'm writing this, I hadn't looked.  Hang on.

Nope, it doesn't seem like that's the answer.  Here are the Corsi percentages for teams behind by one goal:

2007-08: 54.2%
2008-09: 53.7%
2009-10: 54.0%
2010-11: 54.5%
2011-12: 54.4%
2012-13: 53.9%

It looks pretty level, with no obvious evidence of changes in "behind by 1" Corsi patterns.

So, if it's not that, what is it?  And, does anyone know if the "getting outshot means it's more likely you won" effect continued after 2010-11?

-------

Anyway, even without fully understanding what's going on,  I think all this constitutes enough evidence that we need to take the "shot quality matters" hypothesis seriously.  As we've seen:

1.  Since 2011-12, there's a negative correlation between Corsi and SH%;

2.  Since 2010-11, a high shooting percentage this year is an indicator of more goals next year; 

3.  In 2009-10, goals suddenly became as good a within-season predictor as Corsi;

4.  In 2009-10 and (especially) 2010-11, outshooting your opponent became an indicator of losing the game, rather than winning.

I guess it's possible that what we're just looking at is random luck, and that the same stroke of random luck created all four phenomena.  But ... really?  I think that, at this point, it seems that some kind of "not luck" explanation is more reasonable.

Much more plausible than luck, IMO, is that I've just done something wrong, or that I haven't interpreted the evidence correctly, or that there are other arguments that counterbalance what I've said here, or that I just screwed up the data somehow.  

And, again, I'm not saying that this is *proof* that shot quality and Corsi are related, just that it's good enough evidence that you have to at least consider it.  Seriously, doesn't it seem like there might be something there?  


-----

UPDATE: On October 29, one day before this post, Tyler Dellow published a post about the anomaly where winning teams switched from outshooting to getting outshot.  (Save it now if the link works; his site is likely to be down a fair bit.)

The trend of winning teams getting outshot continued in 2011-12, but then things went back to "normal" in 2012-13 and so far in 2013-14.  

Tyler promises an investigation of what changed, which I'm looking forward to, because I have no idea.


(There are seven parts. Part II was previousThis is Part III.  Part IV is next.)
  

Labels: , , ,

Sunday, October 20, 2013

Corsi, shot quality, and the Toronto Maple Leafs, part II

A few follow-ups from the last post about the Leafs and Corsi.  

1.  A few  writers published good responses of some of my arguments.  Here's Eric T, here's Draglikepull, here's Nick Emptage, and here's Cam Charron.  They all pretty much disagreed with me; they think the Leafs' shooting was just luck.  

Oh, and this 2010 post from Tom Awad also notes a negative correlation between shots and shooting percentage.

2.  For every NHL game, the ESPN website provides a diagram of the location of every shot for both teams.  On one internet forum, "Leo Trollmarov" posted those diagrams for the Leafs' first seven games this year.  Here's one, from the Colorado game:


I noticed that the Leafs seem to have had more close-in shots than you'd expect.

Take the two diagonal "trapezoid" lines behind the net, and extend them until they meet in the high slot.  Along with the goal line, they now form a triangle where shots are presumably more dangerous.  At least I hope they're more dangerous, since my argument mostly depends on it.

In those seven games, the Leafs were outshot 242 to 199 overall.  However, in "triangle" shots, it was only 58-57.  (In the game above, I count 11 to 4 for the Leafs, although that's a bit misleading because the Avalanche had a few just outside the triangle.)

In other words, even though the Leafs are being outshot overall, they ran almost even in that category of higher-quality shots.

Now, in fairness, I'm cherry-picked my definition of "higher-quality," when I chose that triangle.  I checked a couple of other things, to see if there were patterns -- like, shots from the side boards, and shots from the point.  Those differences seemed minimal.  But the "triangle" effect was significant.  And, even if those shots aren't higher quality, if the Leafs have a different *pattern* of shots, that's something too.

Um, but there's the problem of small sample size.  

Here, let me check the eighth Leaf game ... oops.  The Leafs were out-triangled 11-4, it looks like.  So, yes, maybe the whole thing is just small sample size.  But an effect like that is what I'd be looking for to support the "Leafs got more quality shots" hypothesis.

3.  In his post, Nick Emptage cited a few games from last year where the Leafs were badly outshot or out-Corsied, but still won.  For instance, Nick said,


"In three games against New Jersey, the Leafs were outshot 75-43 at even strength, and were out-Fenwick-Close’d 92-41. ...They took six points from these games."

For two of those three games, the shot quality looks about even.  But, if you look at the ESPN chart for the first game, the one on March 4, that one looks like the Leafs really did have better shots than the Devils.  Toronto won 4-2, despite being outshot 30-23.  But the Leafs actually had five "triangle" shots to the Devils' three.  Also, if you count longer shots, taken from between the blue line and the back of the faceoff circles ... well, the Leafs took only three of those (what I presume are) low-percentage shots.  New Jersey took *seventeen*.

Looking at some of the other games Nick cites ... against Florida, on March 26, the Leafs were outshot 42-31.  But they were equal in triangle shots, 10-10.  And Florida took 19 long shots to Toronto's 10, which accounts for most of the difference.

And, February 7 against Winnipeg, where the Leafs won 3-2 but were outshot 25-18 ... that one is the most obvious.  The Leafs had eight triangle shots to Winnipeg's three.  And, Toronto had only one long shot to Winnipeg's 11.  

Overall, I looked at seven of the games Nick cited.  Four of them did look like shot quality wasn't a factor, and the Leaf win was probably luck.  But, those other three games, I think you could argue that the Leafs won because, in part, the Leafs had better, albeit fewer, shots on goal.

Now, I'm not sure if this means anything for my theory.  Because, if you look at any game where one team won despite being outshot, there's a pretty good chance they had better shots, even if shot quality is random.  That's because you're cherry picking the anomaly games.

Also, if you look, you might be able to find games that go the other way.  There actually weren't that many games where the Leafs lost despite having more shots on goal.  Maybe this Carolina game qualifies ... The shots were 42-39, but the score was 1-4.  But ... although the Leafs had more long shots than the Hurricanes, they also had more triangle shots.

I dunno, but, just looking quickly, it doesn't seem that farfetched that the Leafs are taking closer shots than their opponents.  But, you'd have to look at all the games, not just my selective sample.  And, I suspect, there are analysts out there who study shot quality on a regular basis, and I haven't seen anyone say that the Leafs were different than normal.

But, just sayin' ... from this, the shot quality hypothesis at least seems *plausible*, doesn't it?

4.  Last season, the Leafs had a higher shooting percentage in 32 of their 48 games.  That is, if you picked the winner by who had the higher shooting percentage, the Leafs would have been 32-16 (.667) on the season.

Can that be all score and power play effects?  Doesn't seem like it.  Well, maybe it could, with some luck added on.  I'll just throw that on the "hmmm..." pile with everything else.

5.  In my post, I found a negative correlation between Corsi and shooting percentage, which supports my argument that there's a tradeoff between quantity and quality of shots.  However, in his post, Eric T. suggested that might just be a reflection of different score ratios.  Teams take fewer (but better) shots when ahead by two goals, so the correlation might just be the fact that teams vary in how often they're in that situation.

He has a point.  To take one example, the Leafs played around 750 minutes with the score tied last year; Ottawa played 1,071 minutes.  Toronto played 954 minutes with the lead, while the Senators played only 622.  

So, I checked the six-year correlation using the "game tied" Corsis.  And it disappeared: it went from -0.22 down to -0.02, which is effectively zero.  I hadn't noticed that, because I had only checked last season, when the correlation was -0.24.  In fact, it was also -0.24 the year before.  But, in each of the four years prior, there was actually a *positive* correlation:

2007-08: +0.08
2008-09: +0.02
2009-10: +0.02
2010-11: +0.01
2011-12: -0.24
2012-13: -0.24

I'm not sure what to make of this, whether it's just random, or whether something changed the last two years.  But, I have to admit, this makes my hypothesis a little less justifiable.  

So, I thought it would be good to look at more data.  And, just a couple of hours ago, Nick was kind enough to send me team shot/goal data back to 1997-98.  (Thanks, Nick!)

Omitting last season, the correlation between shot quantity and shooting percentage since 1997-98 was -0.13 (not adjusting for season).  That seems legitimate, and reasonable in magnitude.  (It could be due to score and power-play effects, of course.)

But, last year ... that was different.  Last year, the correlation was -0.52.  

That is HUGE shot quality effect.  Now, when you switch to 5-on-5 only, the correlation drops to -0.42.  And, as we saw, when you switch to Corsi and tied situations only, it drops further to -0.24.  But, still.

Why so high?  In part, it could be the shorter season -- maybe score effects and power play effects didn't have enough chance to cancel out, and we're just seeing artificial differences.  But ... -0.52?  That high?  It doesn't seem like that could be all of it.

Is there something unusual about last season?  


(There are seven parts. Part I was previous. This is Part II.  Part III is next.)

Labels: , , ,

Tuesday, October 15, 2013

Corsi, shot quality, and the Toronto Maple Leafs

The Toronto Maple Leafs had a decent season in 2012-13, finishing fifth in the conference and making the playoffs for the first time since 2004.  But, perhaps, we fans of God's Team shouldn't get too optimistic.  For months now, hockey sabermetricians have been arguing that the Leafs were still a bad team -- a bad team that just happened to get exceptionally lucky.

But ... I've been fiddling a bit with the numbers, and I'm not sure I agree.

Before I get to my own case, though, let me tell you why the consensus says what it says.  First, Sean McIndoe has an excellent Grantland article that summarizes the issue.  Second, when you're done that, here's my own summary, which is a bit more statistical.  

-------

One of the new sabermetric statistics in hockey is the "Corsi" statistic.  Corsi is much like the NHL's official "plus-minus", but, instead of goals, it counts shots.  (Not just official shots on goal, but all shots directed at the net.)  

A player's Corsi is the difference between team shots for and shots against while he's on the ice in 5-on-5 situations.   Applied to teams, Corsi is just the difference between shots taken and shots allowed.  

The idea is, that there's a lot of luck in terms of whether shots actually go in the net.  So, instead of goals, you can better measure a team's talent by looking at shots.  It's the baseball equivalent of using Runs Created instead of runs scored.  In the baseball case, you eliminate "cluster luck" (as Joe Peta calls it), to get closer to true talent.  In the hockey case, you eliminate "bounce in off a player's butt luck" (among other randomness) to also get closer to true talent.

Corsi is a very good predictor of team success.  In one study, Corsi correlated with team standings points at r=0.62, which is pretty high.

So, the consensus is that if a team's Corsi doesn't really match their won-lost record, the difference is probably luck, and the team shouldn't be expected to repeat. 

Last year, Toronto did not look good in the Corsi standings.  In 5-on-5 situations, they took only 44.1 percent of the shots (meaning their opposition took the other 55.9 percent).  That was worst in the NHL.

So how did the Leafs win so many games, finishing in the top half of the standings?  Even though they took few shots, the shots they did take went in at an exceptionally high rate.  The Leafs had a 10.56% shooting percentage (goals divided by shots on goal), the highest in the league.  No other team was over 10.  The league average was roughly 8, with a standard deviation of roughly 1, so the Leafs were well over 2 SDs above the mean.

Now, you might be thinking: "Sure, the Leafs took fewer shots, but maybe it's just that they took BETTER shots, and that's why they did so well.  Corsi counts all shots equally, whether they're weak shots from the point, or point-blank shots with the goalie out of position.  How can you call the Leafs a bad team without also checking their shot quality?"

The sabermetric community responds that, if you look at the evidence, shot quality seems to be luck, rather than a skill that varies among teams to such a large extent.  If shot quality were actually non-random, a team with a high shooting percentage this year would tend to also have a high shooting percentage next year.  But that doesn't seem to happen.  One study, by Cam Charron, divided teams into five groups based on their shooting percentage this year.  The following year, all five groups were almost identical!  If you look at Charron's chart, there actually is a small effect that remains, but it's only about 10 percent of the original.  In other words, you have to discount 90 percent of the differences between teams.

Another study computed shooting percentages for individual players.  There were substantial differences, but: (a) only two players had shooting percentages higher than the entire Leaf team last year; (b) there's still luck in the individual numbers, so even those players probably don't have that kind of talent; and (c) those players may be taking the team's higher-quality shots because of their role, rather than because they create those shots.  So, it doesn't seem like the Leafs' 10.56% could be actual talent.

So, the argument in a nutshell: 

-- the Leafs took very few shots
-- teams that take very few shots are usually bad
-- the Leafs weren't very bad only because of their exceptionally high shooting percentage
-- an exceptionally high shooting percentage is usually luck

Therefore, the Leafs were probably just a bad team that got lucky.

------

I'm going to argue that that's not necessarily right.  There's another explanation that works just as well.

I'll give you that explanation now, in case you don't feel like reading the numbers to follow.  Actually, instead of the explanation, I'm going to give you an analogy, which might convey it in a more meaningful way.

A company pays its commissioned salesmen in cash, normally in 20 Euro bills.  The value of a Euro fluctuates, so the workers have learned that you can figure out who made the most money just by counting the bills.  If Joe has 35 bills, but Mary has 38, then Mary made more money than Joe.

One month, the paymaster happens to have some extra British currency he wants to get rid of, so he substitutes pounds for Euros in Mary's pay envelope.  A pound is worth more than a Euro, so instead of 42 banknotes of 20 euros, Mary receives 35 banknotes of 20 pounds.  Also, Mary wins the "salesperson of the month" award.

The sabermetricians seize on this.  

"We have found that the statistic called 'Borsi,' which is the number of banknotes received, is one of the most realiable indicators of sales performance," they say.  "But, this month, Mary's 'Borsi' was only 35."

"Sure, Mary won the award because her 35 Borsis were more valuable than normal banknotes.  But, our research shows that receiving British pounds is not a repeatable skill -- salespeople who receive pounds this month tend to revert back to Euros next month.  Therefore, you can't credit that to Mary's talent.  Therefore, she was lucky to make as much in commission as she did."

"In summary:

-- Mary had a low Borsi
-- salesmen with low Borsis are usually not productive
-- Mary did well only because her banknotes were worth more than normal;
-- receiving high-value banknotes is usually just random chance.

Therefore, Mary was lucky."

See the flaw?  Each of the four points above is actually true.  But what the analysis doesn't consider is that, even though receiving high-value banknotes is luck, there is a real, non-random relationship between that luck, and the number of banknotes received.  So, the analysis correctly adjusts for "high-value banknotes luck", but not the "too few banknotes luck" that corresponds to it exactly.

I suspect the same is true for Corsi.  It was luck that the Leafs scored on more than 10 percent of their shots, but that luck is actually tied to the fact that they took fewer shots.  

OK, here we go.

--------

If shooting percentage is almost all luck, the implication is that it's not something a team controls, or can even *choose* to control.  It's like clutch hitting -- just randomness that looks like there's something real behind it.

In that case, you'd expect every team to be around the league average of 8%, in all situations.  Shot quality must be about the same for all teams.  Intuitively, you might think some teams are good enough to have more breakaways and blind passes, while other teams take a lot of harmless shots from the point.  But, the data show otherwise.

Except that ... there ARE situations in which shooting percentage varies meaningfully from 8%.  For instance, a team's shooting percentage depends heavily on the score.  

Here are the situational averages for the six years from 2007-08 to 2012-13, with every team's six year total weighted equally.  

7.60% ... down 2+ goals
7.75% ... down 1 goal
7.52% ... tied
8.40% ... up 1 goal
9.19% ... up 2+ goals

(By the way, all the numbers in this post come from David Johnson's data pages at hockeyanalysis.com.  Thanks, Mr. Johnson ... never could have figured all this stuff out otherwise.)


Why such big differences?  My guess is ... when a team is behind in the game, it changes its style of play.  It probably presses a little more in the other team's zone, trying for better opportunities -- which is why its percentage rises a little bit.  On the other hand, when it presses more, that increases the chance of being caught behind on defense.  That gives the other team more chances at odd-man rushes and breakaways.  Which is why the opposition -- the team that's up 1 or 2+ goals -- sees its shooting percentage rise significantly, all the way to 9.19%.

I just made that explanation up, off the top of my head ... some of you guys know hockey a lot better than I do, so there's probably a better description of what's going on that would be more plausible to a real hockey strategist.

But, regardless of the details of the explanation: how you play does indeed seem to influence shot quality.  It's not all just random.

So: why isn't it possible that the Leafs' numbers are the result of style of play?  Couldn't they be deliberately playing the "up 2+ goals" style of play all the time?  If they're the only ones doing that, one team out of 30, it would be too small to show up in the statistical studies, and it would still look like shot quality is 90% luck.

I'm not saying they *are* doing that, just that it's *possible*.  

------

Now, when you look at the above numbers, you might think: it must be the team that's UP that changes the style of play.  Because, that's the team that looks like it gets the much bigger advantage in shot quality!  The team that's behind probably doesn't like it, but has no choice.

But then you'd ask the obvious question: if playing that style is so beneficial, why don't teams do it ALL THE TIME, instead of just when they're in the lead?

The answer is: it's not that beneficial.  The higher shooting percentage is offset by the fact that the teams in the lead take fewer shots -- that is, they have a lower Corsi.  Here are the percentages of (Corsi) shots taken based on score:

57.0% ... down 2+ goals
54.1% ... down 1 goal
50.0% ... tied
46.0% ... up 1 goal
45.1% ... down 2+ goals

This makes sense too.  If you're behind in the game, you have to concentrate on offense more than on defense.  The higher offense means you'll be taking more shots.  

But, as we saw, the lower defense means you'll be giving the other team better quality shots.  

The quantity and quality factors go opposite ways, and they roughly cancel each other out.  How do we know that?  First, it just looks like it to the eye; if you put the numbers together, one goes up roughly at the same rate that the other goes down:

57.0% ... 7.60% ... down 2+ goals
54.1% ... 7.75% ... down 1 goal
50.0% ... 7.52% ... tied
46.0% ... 8.40% ... up 1 goal
45.1% ... 9.19% ... up 2+ goals

But, more empirically, we know from goal scoring, which remains roughly even between the teams regardless of the situation.  Here are the rates of goals scored (team and opposition) per 60 minutes of even strength play:

2.42 - 2.32 ... down 2+ goals
2.39 - 2.26 ... down 1 goal
2.21 - 2.21 ... tied
2.26 - 2.39 ... up 1 goal
2.31 - 2.42 ... up 2+ goals

It's not perfectly even ... being down actually gives you a small advantage in future goals.  That might be random, but it might be real.  There's a plausible reason it might happen.  The team that's ahead has an interest in limiting scoring by wasting time.  It might be worth playing a style that gives the opponent a slight advantage in expected number of future goals, if that's offset by a lower probability of getting a goal in the first place.  

-------

So, I can say again: isn't it just possible that the Leafs are deliberately playing the "up 2+ goals" style during tie games?

Here's a comparison of the two sets of numbers.  The first is the "leading by 2+" from the above chart, and the second is last year's Leaf team with the score tied:

2+ games: 43.1% Corsi.  Leafs: 43.8% Corsi.
2+ games: 9.19% shooting.  Leafs: 10.82% shooting.
2+ games: 7.60% opposition shooting.  Leafs: 8.64% opposition shooting.
2+ games: 2.31 goals to 2.42.  Leafs: 2.96 goals to 2.80.

Three of the four numbers are roughly the right magnitude and direction: lower Corsi, much higher shooting percentage, slightly higher opposition shooting percentage.  The goals thing goes the wrong way, though. 

Still, reasonably consistent with the Leafs choosing to play a "concentrate more on defense and jump on opposition mistakes" style of game.  

--------

The situational numbers suggest that one way to lower your Corsi and raise your shooting percentage is to consciously choose defense over offense.  But it can also happen randomly, because opportunities are random.  Every player, every time he has the puck, has to decide whether to shoot or not.  Some days, you might have cases where the best option is to shoot.  Other days, you might have options where the best option is to pass, in hopes of a better shot.

Imagine a player has the puck.  If he shoots, he has a 5% chance of scoring.  If he gets the puck to his teammate on the other wing, the chance goes up to 10%.  Should he pass?  If he does, there's the risk that the defense will intercept the pass and take over.  Given these numbers, he should only choose the pass if there's a better than 50/50 chance it'll get through the defense.  

Now, options like that present themselves all the time, with different probabilities.  Sometimes, you have only a 15% chance of completing a pass (across the slot through a bunch of legs, say), but, if it works, there's an 80% chance of the shot going in.  Sometimes, it turns out nobody is open, and the 4% wrist shot from a bad angle is your best option.

All that, to a certain extent, is random.  Perhaps one day, by chance, everything is a shot.  You may take 60 Corsi shots, at 5% each.  Your shooting percentage will average 5% -- 3 goals in 60 shots.

The next day, randomly, everything is a 50/50 pass to a 10% shot.  You'll make 60 passes.  30 of them will be intercepted, and 30 of them will turn into Corsi shots.  Your shooting percentage will average 10% -- 3 goals in 30 shots.

Corsi will think your first day was a much better day: you had twice the shots!  But ... it wasn't.  One day you had more low-probability shots, and one day you had fewer high-probability shots.  One day you had 60 five-dollar bills, and the next day you had 30 ten-dollar bills.  

My example is too extreme ... your swings won't be that wide, from 60 passes to 60 shots because of random changes in offense and defense patterns.  But there will be SOME random variation in opportunities, which means there will be SOME random variation in Corsi that will move shooting percentage the other way.  

In this scenario, it is absolutely true that shooting percentage is not a repeatable skill.  But that doesn't mean that you didn't earn the extra goals.  You earned the extra goals because the "lucky" shooting percentage came from "unlucky" reductions in shots taken.

--------

Here's more evidence that Corsi and shot quality are inversely related.

I again looked at the last six years of the NHL, 180 team-seasons.  The correlation between shooting percentage and Corsi was -0.22.  When I took only the 36 most extreme shooting percentages, the correlation was -0.37.  

In the regression, each point of shooting percentage decreased Corsi by 0.785.  That means the Leafs' shooting accounted for around 2 points of Corsi, enough to move them from 44.1 (last) to 46.1 (third-last).

I think that's not enough of an adjustment, that the Leafs are more extreme than the regression suggests. That would be possible, I think, if the Leafs are different from other teams in some way other than random variation in shots.

But that's just my gut.  And I may be improperly biased by knowing, in advance, that they had a positive goal differential.  

--------

After looking at all these results, my overall view of Corsi is that it's decent enough to tell us something useful, but way too biased by situation and shot quality to be taken seriously on its own.  

As for the 2012-13 Leafs, I suspect shot quality is the biggest explanation for their low Corsi and high shooting percentage.  Not that I'm dismissing luck -- any time you have an extreme result, without a full explanation, luck is probably involved somewhere.  So, yes, I think the Leafs were a bit lucky in their shooting.  But, the rest of it, I think, was something real.  Specifically, I think it was some combination of:

1.  The Leafs playing a more defensive style, allowing them to capitalize better on opposition mistakes;

2.  Taking fewer low-percentage shots, and passing instead; and

3.  Random variation that made passes a better option more often.

And I say that because, from all the results I looked at, it seems that Corsi and shot quality are indeed related to each other.  If you accept Corsi, you can't dismiss shot quality.  To a significant extent, they're opposite sides of the same coin.  


(There are seven parts.  This is Part I.  Part II is next.)


Labels: , , ,

Tuesday, October 08, 2013

Statistical significance is not a property of the real world

Here's a quote from a recent post at a sports research blog:

"... strength of schedule does not have a statistically significant effect on winning percentage in FBS college football."

That sentence doesn't make sense.  Why?  Because there can be no such thing as a "statistically significant effect" in college football.  Real-life effects do not possess the property "statistically significant."  They might be big effects, they might be small effects.  They might be positive, or maybe negative.  They might be zero effects, which means no effect at all.

But they cannot be "statistically significant."  Either strength of schedule has an effect on winning percentage, or it doesn't.  

(This is obvious if you think of other real life effects.  Would an extra week of vacation have a statistically significant effect on your job satisfaction?  Would a sale on soup have a statistically significant effect on how much you buy?)

"Statistically significant effect" has no meaning outside of the context of a particular statistical procedure.  Statistical significance is a property of the *evidence* of an effect, not the effect itself.  

That's not always obvious, because the word "effect" is being used to mean two different things.  In normal conversation, we use "effect" to mean the real life impact.  But in research studies, they will often use "effect" to represent the study's ESTIMATE of the real-life effect.  The two are not the same.

What you can say, instead, is:

"... my study was not able to find a statistically significant non-zero estimate of the effect of strength of schedule on winning percentage in FBS college football."

That works -- but as a statement about your study, not about college football. 

What does that sentence say about real life?  You can't tell.  It could be that there really is no effect in college football.  Or, it could be that you didn't have enough data to find the effect.  It could also mean that you didn't look hard enough, one way or another ... maybe you didn't use or the right data, or your model is wrong.

It's impossible for us to know what to think, unless we actually look at your study!  It's very, very easy to design a study, in almost any context, that won't find statistical significance.  Smoking and cancer?  No problem: I'll take three random smokers, and three random smokers, and compare.  It's almost certain that's not enough data to create statistical significance, even though, of course, smoking *does* cause cancer.  

"Not statistically significant" means, at best, "I didn't find evidence."  I wish researchers would say that more explicitly:

"... my study failed to find statistically significant evidence that strength of schedule has an effect on winning percentage."  

That does two things.  First, it reminds the reader that statistical significance is only about a level of evidence.  And, second, it leads the reader to wonder, "where did you look?"

-----

OK, so this post was meant to talk just about the use of the words "statistically significance," about how they apply only to you and your study, and not to the real world.  But, now, it looks like we're heading into "absence of evidence is not evidence of absence" territory again.  Sorry.

-----

If you don't find statistical significance, and you want to use that to argue that there's no real world effect, you can't stop there.  You have to tell us where you looked.  You have to say, "the estimate was not statistically significant BASED ON MY METHOD AND DATA."  And then you show the method and data.  

For instance:

"... my regression tried to predict winning percentage from strength of schedule, looking at 10 seasons of 100 teams each, and I found no statistically significant evidence of an effect."

That would work better.  Now, we have an idea of how you tried to look for the evidence.  Maybe, now, we can say, "Well, if he found no significant effect based on all that data,  maybe there really is none!  It looks like he looked pretty deep."

But, that's still not sufficient.  Because, who knows how much data is enough?

Suppose a researcher says, "I wanted to find out if chemical X causes cancer.  So I looked at 10,000,000 people and found no statistically significant effect."

That sounds like chemical X is safe, right?  I mean, ten million people, surely that would provide enough evidence if it existed!  But ... no.  If X causes cancer in only one person in a million, then the sample isn't nearly large enough.  Even if your data cleanly splits into X and non-X -- 5,000,000 people each -- the expected difference is only five cases of cancer!  There's very little chance of finding statistical significance in that.

There are ways to actually calculate whether the sample size is high enough.  But you don't actually have to go through the trouble.  The regression will do that for you automatically, when it gives you a standard error and confidence interval for your estimate.  If you *do* have enough data, you'll get a pretty small confidence interval, hugging zero.  If you don't have enough data, the interval will be wide.

Suppose you do a study on whether an extra hour of class affects a student's percentage grades.  And you find that the estimate of the effect is not statistically significant.  

You should certainly tell us that your estimate isn't significantly different from zero.  But what's your confidence interval?  If it's, say, plus or minus 1 point out of 100, that's pretty decent evidence.  But if it's really wide -- say, between minus 10 and plus 30 -- it's obvious that your study isn't strong enough.  Because, that result doesn't narrow it down, much, does it?  I mean, if your confidence interval includes every plausible reasonable prior guess at what the class is worth ... what's the point?  

In a case like that, absence of evidence is really absence of a good enough study.

-------

A researcher saying there's no effect because he didn't find statistical significance is like a kid saying he didn't do his homework because he couldn't find a pen in the house.  

Either way, you have to go out of your way to show how hard you looked, and to prove that you would have found it if it were there.  


Labels: ,

Tuesday, October 01, 2013

Luck in chess matches

While web surfing, I stumbled over a two-part series on luck in chess, by Matthew S. Wilson.  It doesn't talk about the "micro" view of where the luck comes from (as I did), and it doesn't much talk about the balance of luck vs. skill.  It just implicitly acknowledges that, once you account for player skill, the result of a game is like a coin flip (where the probability of a head depends on how much better one player is than the other).    

Wilson analyzes how that applies to a series of games, why it's hard to get statistical significance from a single match.  Also, he talks about how long a match would have to be in order to achieve a reasonable level of competitive balance.


Labels: ,