Corsi, shot quality, and the Toronto Maple Leafs, part III
My last two posts argued that there might be an inverse relationship between shot quality and shot quantity -- or, in other words, between Corsi and shooting percentage (SH%).
Most hockey analysts disagreed with me. Which is fair enough; so far, the only evidence I've really put forward is the negative correlation, the last two years, between Corsi percentage and shooting percentage. In each of the seasons 2011-12 and 2012-13, in even-strength tie-game situations, the team correlation was -0.24. Before that, it was close to zero.
I spent the last week searching for other evidence, and I think I finally found something.
-------
If shooting percentage in tie games is just luck -- or mostly just luck -- you should expect no correlation between shooting percentage this year, and shooting percentage next year. And that's pretty much what you see in the data. From 2007-08 to 2011-12, the team "that-season-to-next-season" correlation was only about 0.03 -- virtually zero. (All "Corsi" numbers in this post are even-strength tie-game situations only.)
Doing the same thing to predict goal percentage from goal percentage (the percentage of goals in your games that are yours), I found a stronger relationship, a correlation of 0.27.
And, as the hockey analytics community has shown, this year's Corsi is even better for predicting next year's goal percentage. That correlation came out to 0.40.
So: Corsi is an excellent predictor, and shooting percentage appears to be just random. So, you'd expect that if you try to predict next year's goals from this year's Corsi, knowing this year's shooting percentage shouldn't be much of a help. Right?
Well, apparently, that's *not* right. I ran that regression, and, surprisingly, shooting percentage was significant, both statistically and practically. The SH% variable had a p-value of .09, and the actual effect was large.
It turned out that every point of shooting percentage was worth 0.83 points of goals next year. So, if the league shooting percentage was 7.5%, but you had 8.5%, then, all things being equal, you should score 50.83% of goals next year.
Compare that to Corsi. Every point of Corsi was worth 0.72 points of goals next year. So, all things being equal, if this year you took 51% of shots, next year you should score 50.72% of goals.
So, the two were roughly similar, on a percentage-point-by-percentage-point basis.
In the particular case of the 2012-13 Maple Leafs ... they had a shooting percentage of 10.82, as compared to the league average of 7.77 (actually, that 7.77 is equally weighting all teams, so the true mean is probably a bit lower that that, but never mind). The difference of around 3.1 points corresponds to a goal percentage difference of 2.6. That's quite a lot.
Of course, the Leafs' low Corsi percentage of 43.8 more than makes up for that. So, I'm NOT saying this is a *good* strategy on the part of the Leafs (if, in fact, it *is* a strategy). I'm just saying that I think that (a) the high shooting percentage is partly real, and (b) the low Corsi is partly the flip side of the high shooting percentage.
-------
But the relationship might even be stronger than that. The above coefficients were for a regression that included five seasons worth of data, 2007-08 to 2011-12. If I limit it to only the most recent three seasons, the results are even more striking.
For the past three seasons, the coefficient of SH% is substantially higher, at 1.21. Meanwhile, the coefficient of Corsi stays pretty much the same, at 0.82. Here, let me give you the regression equation:
Next Year G% = 0.82 (this year Corsi%) + 1.21 (this year SH%) - 0.12
In the Leafs' case, their 3.1-percentage-point advantage in SH% translates to a 3.75% increase in next year goal percentage. Of course, their 6.2 percent disadvantage in Corsi works out to a 5.08% *decrease* in goal percentage. Again, I'm not saying the Leafs are superstars or geniuses ... I'm just arguing that you might have to offset some of their exceptionally low Corsi with some of their exceptionally high SH%.
--------
Now, you might argue that I'm guilty of selective sampling, when I choose to look at only the last three seasons. Which is true, except that I think you can justify the apparent cherry-picking, because there's other evidence that recent seasons are, in fact, different.
And, actually, that difference is actually the most interesting thing I found in these numbers -- there seems to have been a sudden, recent change in the relationship between shooting and winning.
Two years ago, Bruce McCurdy posted a study investigating the relationship between outshooting and winning games. He found that from 1997-98 to 2007-08, the team with the most shots on goal in a game was significantly more likely to win. In each of those seasons, the team with more shots had an aggregate winning percentages above .500. (The league-seasons ranged from about .505 to .550. The percentages were computed as the percentage of game points received, so as to create a league average of .500. And the study counted all shots, not just tie-game shots.)
So, back then, if you got more shots, you tended to win the game.
But, in 2009-10, the situation reversed -- taking more shots meant you were more likely to have *lost* the game. That year, the team with more shots had a winning percentage of only around .490.
In 2010-11, it got even more extreme. The team with more shots played at only a .475 rate. Put another way, teams that were outshot posted a .525 record! That's almost the exact reverse of what it had been in prior years.
Check out McCurdy's table from his article: twenty-five of the 30 teams had higher winning percentages in games where they were outshot.
That's kind of shocking, in two ways. First, who would have thought that getting outshot would tend to be connected to winning? And, second, who would have thought that the relationship between shooting and winning would reverse itself within two seasons, with hardly anyone noticing?
McCurdy's study was written immediately after the 2010-11 season; I don't know if the reversal continued in future years. However, I did calculate that last year, Toronto's record fit the pattern. When the Leafs outshot their opponents, they were 5-7-0. When they were themselves outshot, they were 21-10-5.
-------
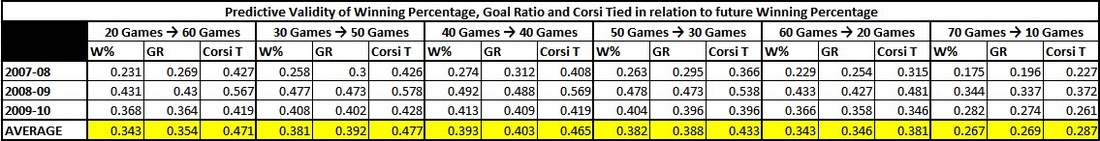
Here's another, similar, bit of evidence. In a recent post (hat tip: Tango), garret9 points to some correlation numbers from JLikens. Those look at early season numbers to try to predict future team wins in the same season.
In 2007-08, tie-score Corsi predicts the near future much better than goals. For instance, if you use the first 40 games of Corsi to predict the next 40 games of winning percentage, the correlation is .408. But if you use the first 40 games of goals, the correlation is only .312.
In 2008-09, Corsi is still better, but less so. The corresponding r values are .569 for Corsi, and .488 for goals.
But, in 2009-10, the difference disappears. Now, Corsi and goals are almost the same, at .419 and .409, respectively. As you move later in the season, the order reverses. If you try to predict 30 games from 50, Corsi and goals actually "tie" at .396. Predicting the last 20 games from the first 60, (or 10 from 70), goals "wins" outright.
That probably wouldn't happen if shooting percentage wasn't measuring something real, would it?
--------
What would cause these sudden changes? Well, it could be that teams started to play an even more extreme style of hockey when leading. Maybe it used to be that, when ahead in the game, teams would get outshot at a rate of, I dunno, 30-25, or something. But, in recent years, maybe teams decided to switch to an even more "opportunistic" style, where they limit their offensive possessions and just capitalize on opponent mistakes, so then they started to get outshot at, I dunno, 33-22, or something.
I just made those numbers up, for illustration, but maybe that's what could be happening.
Hey, wait, I can check that. Seriously, as I'm writing this, I hadn't looked. Hang on.
Nope, it doesn't seem like that's the answer. Here are the Corsi percentages for teams behind by one goal:
2007-08: 54.2%
2008-09: 53.7%
2009-10: 54.0%
2010-11: 54.5%
2011-12: 54.4%
2012-13: 53.9%
It looks pretty level, with no obvious evidence of changes in "behind by 1" Corsi patterns.
So, if it's not that, what is it? And, does anyone know if the "getting outshot means it's more likely you won" effect continued after 2010-11?
-------
Anyway, even without fully understanding what's going on, I think all this constitutes enough evidence that we need to take the "shot quality matters" hypothesis seriously. As we've seen:
1. Since 2011-12, there's a negative correlation between Corsi and SH%;
2. Since 2010-11, a high shooting percentage this year is an indicator of more goals next year;
3. In 2009-10, goals suddenly became as good a within-season predictor as Corsi;
4. In 2009-10 and (especially) 2010-11, outshooting your opponent became an indicator of losing the game, rather than winning.
I guess it's possible that what we're just looking at is random luck, and that the same stroke of random luck created all four phenomena. But ... really? I think that, at this point, it seems that some kind of "not luck" explanation is more reasonable.
Much more plausible than luck, IMO, is that I've just done something wrong, or that I haven't interpreted the evidence correctly, or that there are other arguments that counterbalance what I've said here, or that I just screwed up the data somehow.
And, again, I'm not saying that this is *proof* that shot quality and Corsi are related, just that it's good enough evidence that you have to at least consider it. Seriously, doesn't it seem like there might be something there?
-----
UPDATE: On October 29, one day before this post, Tyler Dellow published a post about the anomaly where winning teams switched from outshooting to getting outshot. (Save it now if the link works; his site is likely to be down a fair bit.)
The trend of winning teams getting outshot continued in 2011-12, but then things went back to "normal" in 2012-13 and so far in 2013-14.
Tyler promises an investigation of what changed, which I'm looking forward to, because I have no idea.
(There are seven parts. Part II was previous. This is Part III. Part IV is next.)
Labels: corsi, hockey, NHL, statistics
posted by Phil Birnbaum @ 10/30/2013 11:46:00 AM
13 comments
![]()
![]()

13 Comments:
So nice to get a fresh viewpoint on this that isn't simply looking to reconfirm already held assumptions.
You are doing the hockey analytics community a great favor here, and don't worry if they resist it at first. There's plenty of us that are frustrated with the limited scope (but unlimited application) of the current hockey analytics.
In a way, it would be dissappointing if the strong-ish correlations found with Corsi ended up being just a short-term fluke, but it wouldn't exactly be surprising.
I wonder if part of it is that the correlations up until 2010 were too high, and the 2011 to 2012 correlations are too low, and there's a natural mean that we'll find eventually?
I'd noticed this effect with Corsi and Goals as well, but it worried me that it was a small number of years driving the data. The one thing that became super clear if you look at all the years together is that it's almost impossible to predict Sh% or Sv%.
A real worry is that with the 48-game season, it's going to take until the end of NEXT season to be able to update the information at all.
I'm also wary of making judgments based on this season. It's so early. In 2011-12, the Maple Leafs were 9-3-1 and everybody was worried they were on thin ice. It's amazing what a playoff run (that MAY have been a fluke, no way of telling right now) can do to expectations when handed a small sample of data at the start of the next season.
Thanks, Mark! Appreciate it! I'm wondering about the fluke aspect myself ... I'd love to know if outshot teams are still winning more games, that would help.
Hi, Cam,
It certainly could be a fluke ... the "outshot teams winning more games" is (very) statistically significant at first glance, but that assumes independence, but that might not hold. It could just be that teams with a faster pace of play (in terms of shots) were worse teams in 2010-11. I should check that.
In case it wasn't clear, none of the results in the post included this season. They did include last season, though.
And, yes, I agree that if you combine all the years, it's hard to see an effect. This all depends on there having been a real change in circumstances in 2009/10ish. More data would help; I certainly agree with you there.
Wait, what I said didn't make sense:
"It could just be that teams with a faster pace of play (in terms of shots) were worse teams in 2010-11."
So, never mind that part.
McCurdy's study was written immediately after the 2010-11 season; I don't know if the reversal continued in future years. However, I did calculate that last year, Toronto's record fit the pattern. When the Leafs outshot their opponents, they were 5-7-0. When they were themselves outshot, they were 21-10-5.
I posted on this the other day. The pattern didn't hold lat season - teams that outshot took more points. It wasn't holding this year either.
I've got some data that I haven't published yet which shows that the outshooting with the score tied didn't change - the difference has to have been in other parts of the game. Maybe teams are playing more of a prevent defence when leading.
You are doing the hockey analytics community a great favor here, and don't worry if they resist it at first. There's plenty of us that are frustrated with the limited scope (but unlimited application) of the current hockey analytics.
Roughy translated that means: "I like the Leafs and I don't like what people are saying about them."
LOL ... I like the Leafs too, but I've been a fan a long time, and I've learned that they usually do suck and there's no point denying it. :)
I'll look for your post, thanks!
About to head out, but I found your post. Good stuff! Coincidence that it came out just yesterday, while I was writing this up.
Will give it a full read when I'm back later. Thanks again!
Seems like a good time for an ICYMI from yesterday: http://puckprediction.com/2013/10/29/why-you-shouldnt-sacrifice-possession-for-shot-quality/
I will look at this more carefully and provide a more thought-out answer. One point though: did your regression models adjust for serial correlation? Especially in small samples, unadjusted models will have biased standard errors, which could mislead you as to what's statistically significant.
Phil;
There is a simple logical argument that indicates shot quality exists.
The stronger team generates more Corsi with the Score tied. Why does Corsi% dip when even strong teams are leading.Why are strong teams 'willing' to sacrifice possession for a better chance to win strategy.
If shot quality wasn't a 'significant' factor these teams would continue to dominate the possession game as they do when tied. Dan
Phil;
Further to my point. Why do successful teams choose to protect their lead. Why change your style at all? Obviously,the goal is to optimize your chance of winning. Thereforethis generally ‘accepted defensive strategy’ only makes sense if it is ‘more’ of an advantage to defend a one goal lead than to try an score another goal – It must be a positive value strategy. IMO it follows that a team CAN reduce shot quality and it is a repeatable skill (in this game state) and/or increase your own shot quality as well. Otherwise, like I said the better teams would be choosing to attack more and not sit back.
There used to be adage in sports that 'the best defense was a good offense' but that doesn't seem to apply to modern hockey. Therefore shot quality and a teams ability to reduce it must exist at least in states other than tie games.
As one small team sample, I know the La Kings went 70++ games or so without losing a game while leading going into the third. It shouldn’t be this easy to protect a lead with so much luck involved in scoring goals. and with such a small difference in talent levels of teams.
Think of blackjack. When a team gets a lead it is as if the cards in the deck change and so do the percentages therefore ‘basic’ strategy must change. In a sense it is a different game. The different states leading /trailing and tie games are different just as power play and shorthanded ones are.though not as extreme.
Anyways, just my two cents worth.
Thanks Dan
It turned out that every point of shooting percentage was worth 0.83 points of goals next year. So, if the league shooting percentage was 7.5%, but you had 8.5%, then, all things being equal, you should score 50.83% of goals next year.
Compare that to Corsi. Every point of Corsi was worth 0.72 points of goals next year. So, all things being equal, if this year you took 51% of shots, next year you should score 50.72% of goals.
The wording here bugs me. A percentage point in Corsi is not the same as a percentage point in shooting percentage.
The standard deviation on Corsi% is about 2.5%. So a team being a standard deviation above average in Corsi would be expected to score 51.8% of the goals the next year.
The standard deviation on shooting percentage is about 0.7%. So a team being a standard deviation above average in shooting would be expected to score 50.6% of the goals the next year.
The argument isn't that shot quality doesn't exist. The argument is that shot quality isn't nearly as important as people assume, that because of its high variability it's a much stronger driver of past results than future results.
And I think what you've done here reaffirms that conclusion -- your numbers suggest it's virtually impossible for a team to have so much shooting talent that they'd perform like a team with average shooting and good (+1SD) shot differential.
Very true, they're not the same. I said "percentage point for percentage point," not "SD for SD". In the Leafs case, they were around +3 percentage points in Sh%, and -6 in Corsi, so in "importance" for the Leafs, it's a 1:2 ratio.
I agree that shot quality is mostly random. As I said, even if it's random, part of the randomness might be related to low Corsi.
Post a Comment
<< Home